


Attacks on commercial vessels from Houthis in the Red Sea are showing no signs of abating. Military action from the US and UK against the rebel group continues.
So, it’s now widely expected that the commercial shipping diversion around the Cape of Good Hope will remain in place for some time in 2024. Currently, almost all major container carriers are opting to take the roughly 3000 nautical mile diversion because of safety concerns.
Market analyst Drewry are suggesting international traders should anticipate disruption for at least the first half of 2024.
With this new status quo, its important for shippers to understand the long-term implications. Rarely is one of the world’s most significant waterways taken out of the equation for such a prolonged period. Here we will explore the key factors of a long term diversion away from the Red Sea.

Long term impacts of Red Sea disruption
Increased logistical costs
The immediate short term impact of Red Sea disruption was an aggressive increase in freight rates, as seen in December 2023 and January 2024 (see Figure 1).
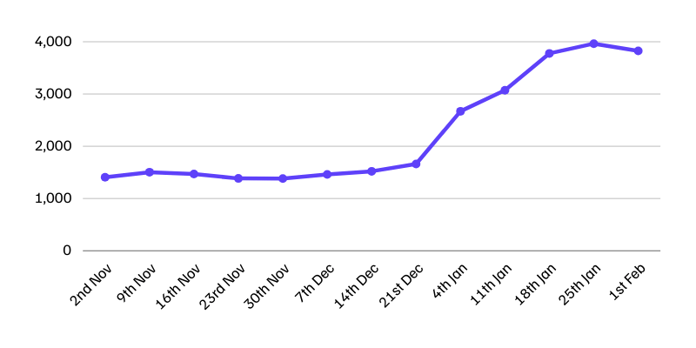 Drewry’s World Container Index up until 01/02/2024 (Figure 1)
Unfortunately, cost increases aren’t only a short-term impact of diverting around the Cape of Good Hope. They're here for the long term. For the shipping lines, there are obvious significant additional costs because of the diversion, which means increased freight rates.
Furthermore, the longer transit time is the equivalent of taking between 1.5-2 million teu out of the market, as a larger percentage of goods are at sea. That reduces the space available for shippers, shifting the supply-demand balance towards higher prices. Even for those not using trade lanes directly impacted by the diversion, more vessels serving the Asia – Europe lane will have knock-on affects for space elsewhere.
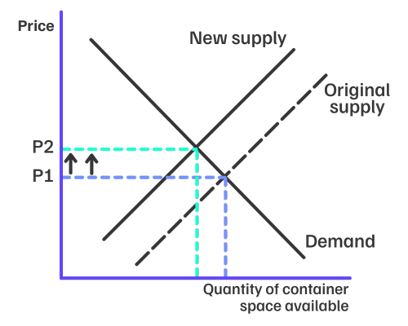
An example supply/demand curve for container shipping (Figure 2)
However, whilst Red Sea diversion has shifted supply backward on the supply/demand curve resulting in higher prices (see Figure 2), some factors could swing the market towards the shipper again.
Primarily, the incoming additional capacity due to enter the market in 2024. 3.1 million teu of space is set to arrive in 2024. That’s on top of the 2.4 million which was added in 2023. Most of these are very large containerships that must be deployed on major trading routes such as Asia – Europe.
Consequently, as the shipping lines take delivery of these new vessels, once again there is a greater supply of capacity and downward pressure on rates. Much of the conversation in the logistics industry of 2023 was about an oversupply of vessels. Too much space and rates were unsustainably low for carriers, many of whom were making losses.
The diversion has changed the picture in many ways, but there isn’t a shortage of space overall.
“Whilst the diversion remains in place, we’re extremely unlikely to see the spot rates of 2023. If we did, the shipping lines would be seriously in the red.
No one can predict with certainty what will happen, but there are certainly several factors which would place downward pressure on rates as the months of this diversion elapse.”
Liam Launders, Head of Sales, WTA
Increased environmental damage
Diverting ships around the Cape of Good Hope in the long term has a significant environmental toll, which will impact your company ESG strategy. We know that transportation is a large part of a product’s overall emissions, which means a longer journey is going to have ramifications. Research suggests transport accounts for roughly a quarter of the EU’s total emissions.
Data from CargoMetrics suggested that ultra-large container vessel emissions were 24% higher in the first 10 days of 2024, than the average for 2023. Indications from SeaRoutes are that a ship travelling around the Cape of Good Hope adds 27% to the emissions total.
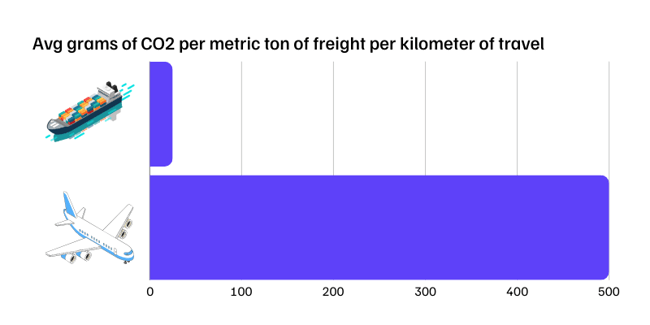
Then that’s before you look at the ramifications of using the air freight market.
Using the Freightos Emissions Calculator, estimated emissions for a sea freight shipment of 1 tonne from Shanghai to Felixstowe in typical circumstances would be 46.33kg of CO2 equivalent. A sea-air shipment of the same journey and weight, using Dubai as the transfer point, would result in 3105.65kg of CO2 equivalent. 6603% higher. With the Shanghai to Dubai sea freight leg only accounting for 29.55kg of that.
Even without taking any action, the diversion around the Cape will impact your company ESG strategy and might require mitigating action to meet targets. That could be in the form of green shipping routes if available, or carbon offsetting.
The additional angle here is the direct financial impacts of increased carbon emissions. From January 2024, shipping lines docking at European ports have been required to report their emissions as part of the EU Emission Trading System, which you can learn about how it with impact shippers here.
These are costs that carriers have already stated will be passed onto shippers. Diversions and longer transit times equals more emissions, which means higher surcharges.
The precise environmental impact on your supply chain is impossible to estimate without using full visibility software. There are endless factors, besides the diversion, which can impact emissions; weight, vessel size, departure port, arrival port, speed of transit, and many more.
With accurate CO2 emission tracking, you know the precise long-term environmental implications of the disruption for your supply chain. Allowing you to take the correct action for your customers and business KPIs. Our WTA Platform provides ISO-compliant CO2 tracking for all shipments, among countless other vital data points for decision making.
The WTA Platform
• Locate your shipments, in real-time.
• Analyse and optimise your supply chain.
• Measure and reduce carbon emissions.

Improved reliability
As the Cape diversion becomes a new normal, it should bring an end to the schedule unreliability that has plagued the industry in December and January.
Operational blank sailings have been commonplace. Ships unable to service port calls for being in the wrong places because of the diversion. Capacity and equipment haven’t been where needed. Diversions have meant weeks added to transit times unexpectedly. There are risks of bottlenecks at ports.
However, as time passes, these short-term challenges will subside. Schedules will readjust to the diversion and reliability will improve.
Ocean freight reliability has never recovered to pre-pandemic levels, but there is an encouraging appetite from the carriers to finally address that. Maersk and Hapag-Lloyd’s recently announced partnership places promising emphasis on the reliability KPI. Aiming to deliver 90% on-time delivery once the network is fully phased in. However that won’t be until the second half of 2025.
The Red Sea crisis is yet another reminder of the vulnerabilities embedded within global trade. As it continues, long-term implications for international traders are profound, extending far beyond the immediate disruptions to shipping routes. Transit times, fuel costs, environmental damage, but also amplified risks to ship security.
The Red Sea crisis serves as a case study of the importance of resilience and adaptability. It emphasises the need for robust contingency planning, diversification of supply chains, and a deeper understanding of geopolitical risks.
Supply chain visibility is a key part of building that supply chain resilience. Book a demo of the WTA Platform today to turn your logistics into a competitive advantage.


